Restaurant Invoice Verification: Cut Food Costs 3-7% with AI
42% of restaurant operators weren't profitable last year. AI restaurant invoice verification catches $5,400-$12,600 in supplier overcharges annually. Food cost control for 3-5% margins.

Sarah Chen's fish supplier had been adding 12% to seabass without telling her—for five months. That one restaurant invoice verification saved £180 per month. With 42% of restaurant operators not profitable last year (NRA 2026), food costs 35% above pre-pandemic levels, and margins averaging just 3-5%, every unverified restaurant invoice directly hits your bottom line. AI-powered supplier invoice verification catches $5,400-$12,600 annually—money that goes straight to food cost control and profit.
Key Takeaways
"Food cost inflation exceeded expectations in 2025, climbing from 82% anticipated to 91% of operators actually reporting increases." — Restaurant365 2026 Industry Survey
"Independent restaurants make 3-5% profit margins on good days. A single undetected supplier overcharge can wipe out a week's profit." — National Restaurant Association / Industry Data
"Beef and veal prices are forecast to rise 5.5% in 2026 (after climbing 15% in 2025), with food-away-from-home prices up 3.7%." — USDA Economic Research Service
Restaurant owners who verify every invoice instead of spot-checking consistently find discrepancies they'd otherwise miss—the difference between checking invoices "when there's time" versus checking every delivery.
"AI invoice scanning reduces manual entry time by up to 60% and delivers a 3-7% food cost reduction within 8-12 weeks—critical when you don't have a full-time bookkeeper."
With 91% of restaurant operators reporting higher-than-expected food costs in 2025 and beef prices forecast to climb another 5.5% in 2026, every dollar matters. For independent restaurants operating on 3-5% net margins, undetected supplier overcharges don't just reduce profit—they eliminate it. Here's how restaurant owners are using invoice comparison and supplier management to protect their margins without hiring additional staff.
The Reality Check: Food costs are 35% above pre-pandemic levels and 42% of operators weren't profitable last year (NRA 2026). With beef forecast to rise another 5.5% this year, every unverified invoice directly hits your 3-5% margin. A single 2% supplier overcharge on $15,000 monthly food spend costs you $3,600 annually — that's nearly a month of profit for most independents.
What restaurant owners discovered:
"My fish supplier had been adding 12% to seabass without telling me — for five months. That one catch saved me £180 per month, and it took 60 seconds to find." — Sarah Chen, Owner, City Bistro, Manchester
"I knew I was probably overpaying somewhere. Now I photograph invoices when deliveries arrive and check the comparison during the afternoon lull. Found $4,200 in overcharges in the first 90 days." — Carlos Rodriguez, Executive Chef/Owner, Aroma Restaurant, Denver
Q: What is line item matching in invoice verification? A: Line item matching compares individual products against the original order and quoted prices — not just invoice totals. This catches per-item overcharges like "$12.99/lb billed instead of $11.99/lb quoted". TRO Matcher extracts and matches line items in under 60 seconds using Google Gemini AI.
Contents
- What does food cost inflation look like for restaurants in 2026?
- How do restaurants lose money on supplier invoices?
- How does AI invoice comparison work for restaurants?
- What supplier management strategies deliver the biggest savings?
- How should restaurant owners track food cost percentage?
- For Accountants and Bookkeepers Serving Restaurants
- Your Data, Your Control: GDPR Article 20 Compliance
- TRO Matcher vs. Alternative Solutions
- How One Bistro Cut Food Costs by 5.2%
- FAQ
Food Cost Control: What Inflation Looks Like for Restaurants in 2026
Food cost inflation for restaurants is running well above general inflation and shows no sign of returning to pre-pandemic levels. The USDA forecasts food-away-from-home prices to rise 4.6% in 2026—faster than the 20-year historical average of 3.5% (USDA ERS).
But the averages mask extreme category-level swings that can devastate a menu built around specific proteins or produce.
Ingredient cost changes heading into 2026:
| Category | 2026 Forecast | Impact on Restaurants |
|---|---|---|
| Beef and veal | +5.5% (after +15% in 2025) | Steaks, burgers, roasts — biggest margin pressure |
| Fresh vegetables | +1.7% | Salads, sides, seasonal specials |
| Poultry | +1.4% | Chicken dishes, wings, rotisserie |
| Eggs | -22.2% (HPAI recovery) | Breakfast items, baking — some relief |
| Dairy | Mixed (-2.5% to +1.0%) | Pizza, pasta, desserts — variable |
| Food-away-from-home (overall) | +3.7% | Menu pricing pressure continues |
Source: USDA Food Price Outlook, BLS Producer Price Index
For a restaurant spending $15,000 monthly on food where beef represents 20% of purchases, a 9.4% beef price increase adds $3,384 annually. On a 4% net margin, you'd need $84,600 in additional revenue just to cover that one category increase.
"Average menu prices increased 31% between February 2020 and April 2025—roughly matching the increase needed to maintain the average 5% profit margin." — NRA/BLS Data
The staff shortage compounds the problem. Restaurant365's survey of 4,000 locations found that rising food costs are now the #2 challenge for operators at 28%, just behind sales volume at 30%. Most independent restaurants don't have a dedicated purchasing manager or accounts payable clerk. The person checking invoices is also managing the kitchen, scheduling staff, and handling front-of-house operations. Invoice verification becomes the task that "gets done when there's time"—which means pricing errors accumulate silently.
How Restaurants Lose Money Without Invoice Verification
Manual invoice processing introduces a documented 1-4% error rate (IOFM 2024), and these errors compound across dozens of weekly deliveries. For a restaurant with $800,000 in annual revenue, even a 2% overpayment rate costs $16,000. Most of these losses are preventable.
Where restaurants lose money on supplier invoices:
1. Supplier price creep
Vendors gradually increase prices between agreed terms and actual invoices. A 2% price creep on $15,000 monthly food spend costs $300/month—$3,600/year. On a 4% net margin, that's the equivalent of losing $90,000 in revenue.
2. Delivery vs. invoice discrepancies
Items are short-delivered but invoiced at full quantity, or substituted with different pack sizes. When the delivery arrives during the lunch rush, nobody has time to check every line item against the invoice.
3. Manual data entry errors
Transferring invoice data to spreadsheets or accounting software has a documented 1-4% error rate. For restaurants processing 40-60 supplier invoices weekly, that's 2-3 errors per week that go undetected.
4. Missed volume discounts
Without visibility into total spending across categories, restaurants miss opportunities to consolidate orders and negotiate volume pricing. Combining protein orders across the week instead of placing multiple small orders can unlock 5-10% discounts.
5. Failed credit tracking
When you return damaged goods or reject short deliveries, the credit memo process is manual and easy to lose. Credits that aren't tracked don't get applied.
6. Contract price violations
Agreed-upon pricing from supplier contracts isn't automatically enforced. When a vendor invoices above the contract rate, someone needs to catch it—and that someone is usually already doing three other jobs.
"Restaurants operate in a uniquely fast-paced, high-variance environment where cash flow changes by the hour, not just by the month. Generic accounting tools often fall short." — National Restaurant Association
If you've ever paid a supplier invoice without checking it because the dinner service was starting in 20 minutes, you're not alone—but that's exactly where money disappears. Modern receipts scanning catches these errors at delivery—the same technology handles fuel receipts, equipment invoices, and produce slips.
Food costs eating your margins? Restaurant owners find 3-7% savings within 8 weeks. Upload your top 5 supplier invoices and see what's hiding.
How Restaurant Invoice Verification Works with AI (Save 400+ Hours Annually)
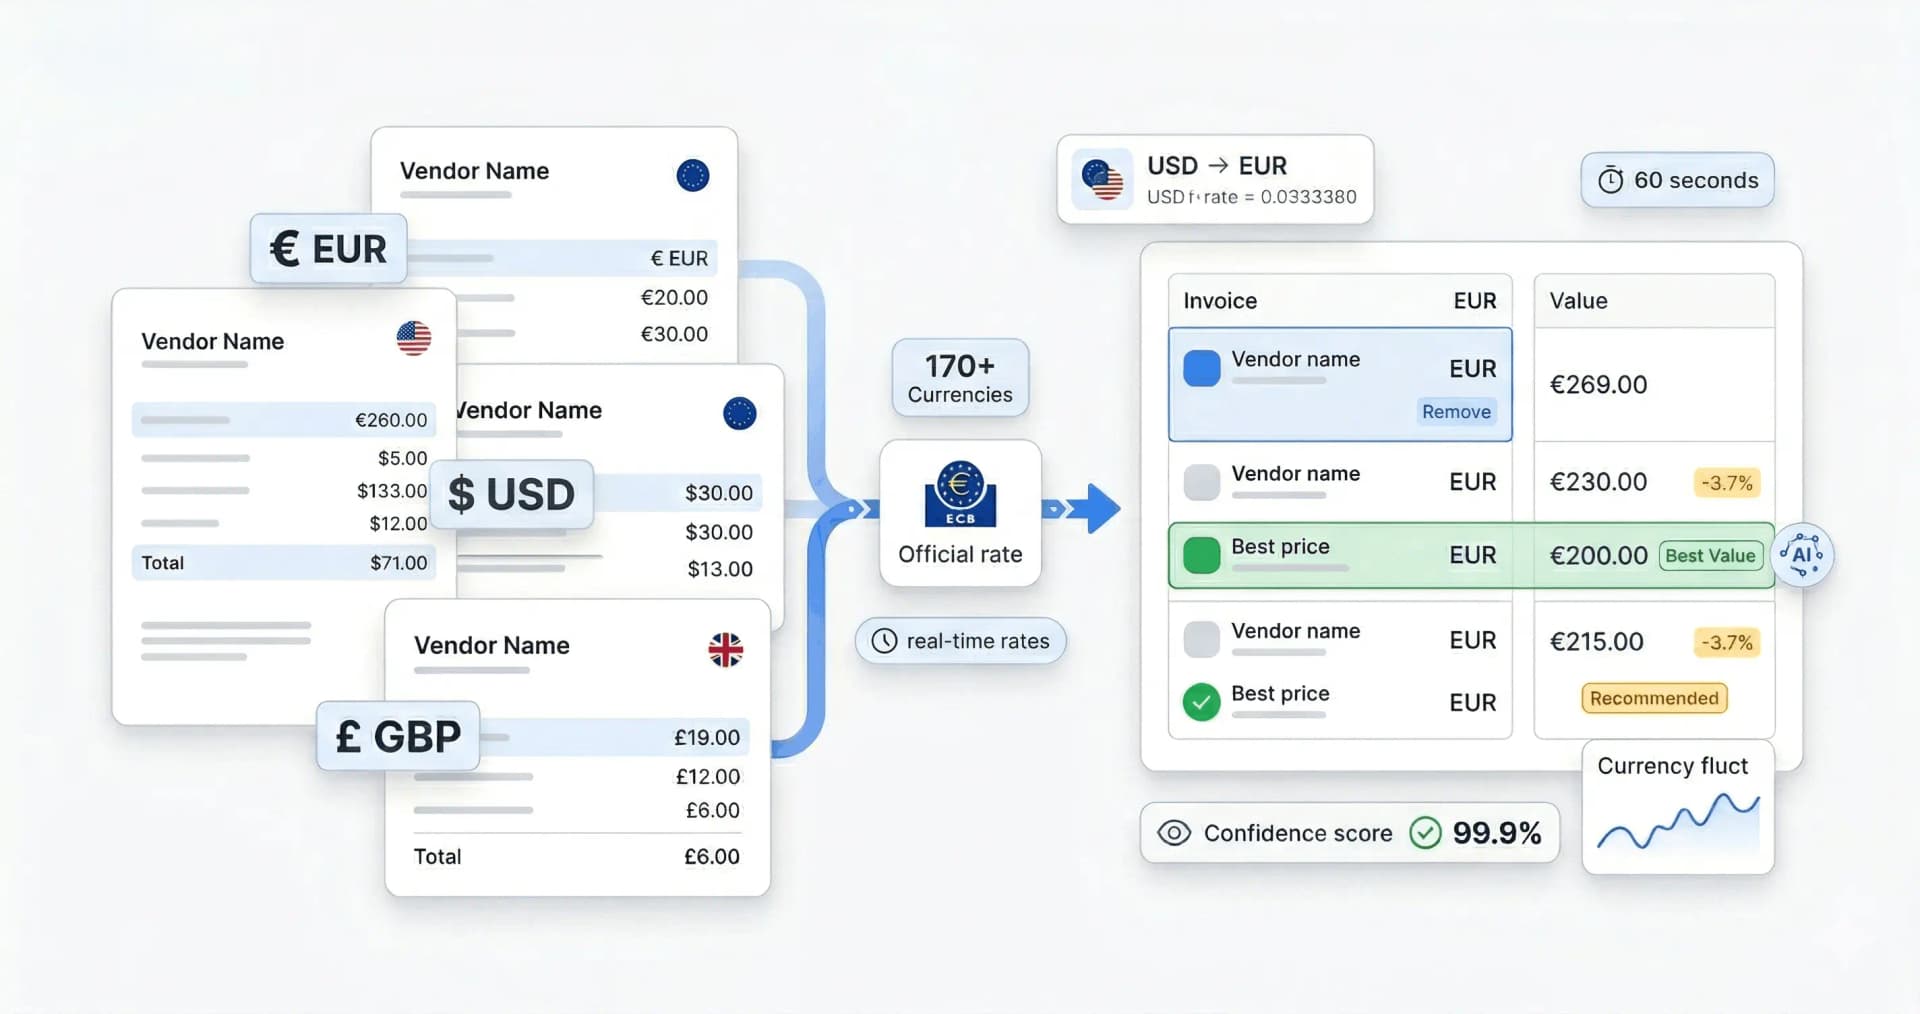
AI-powered invoice comparison extracts data from supplier invoices automatically—regardless of format—and compares them against purchase orders, previous pricing, and competing vendor quotes in seconds.
How the process works for restaurant owners:
-
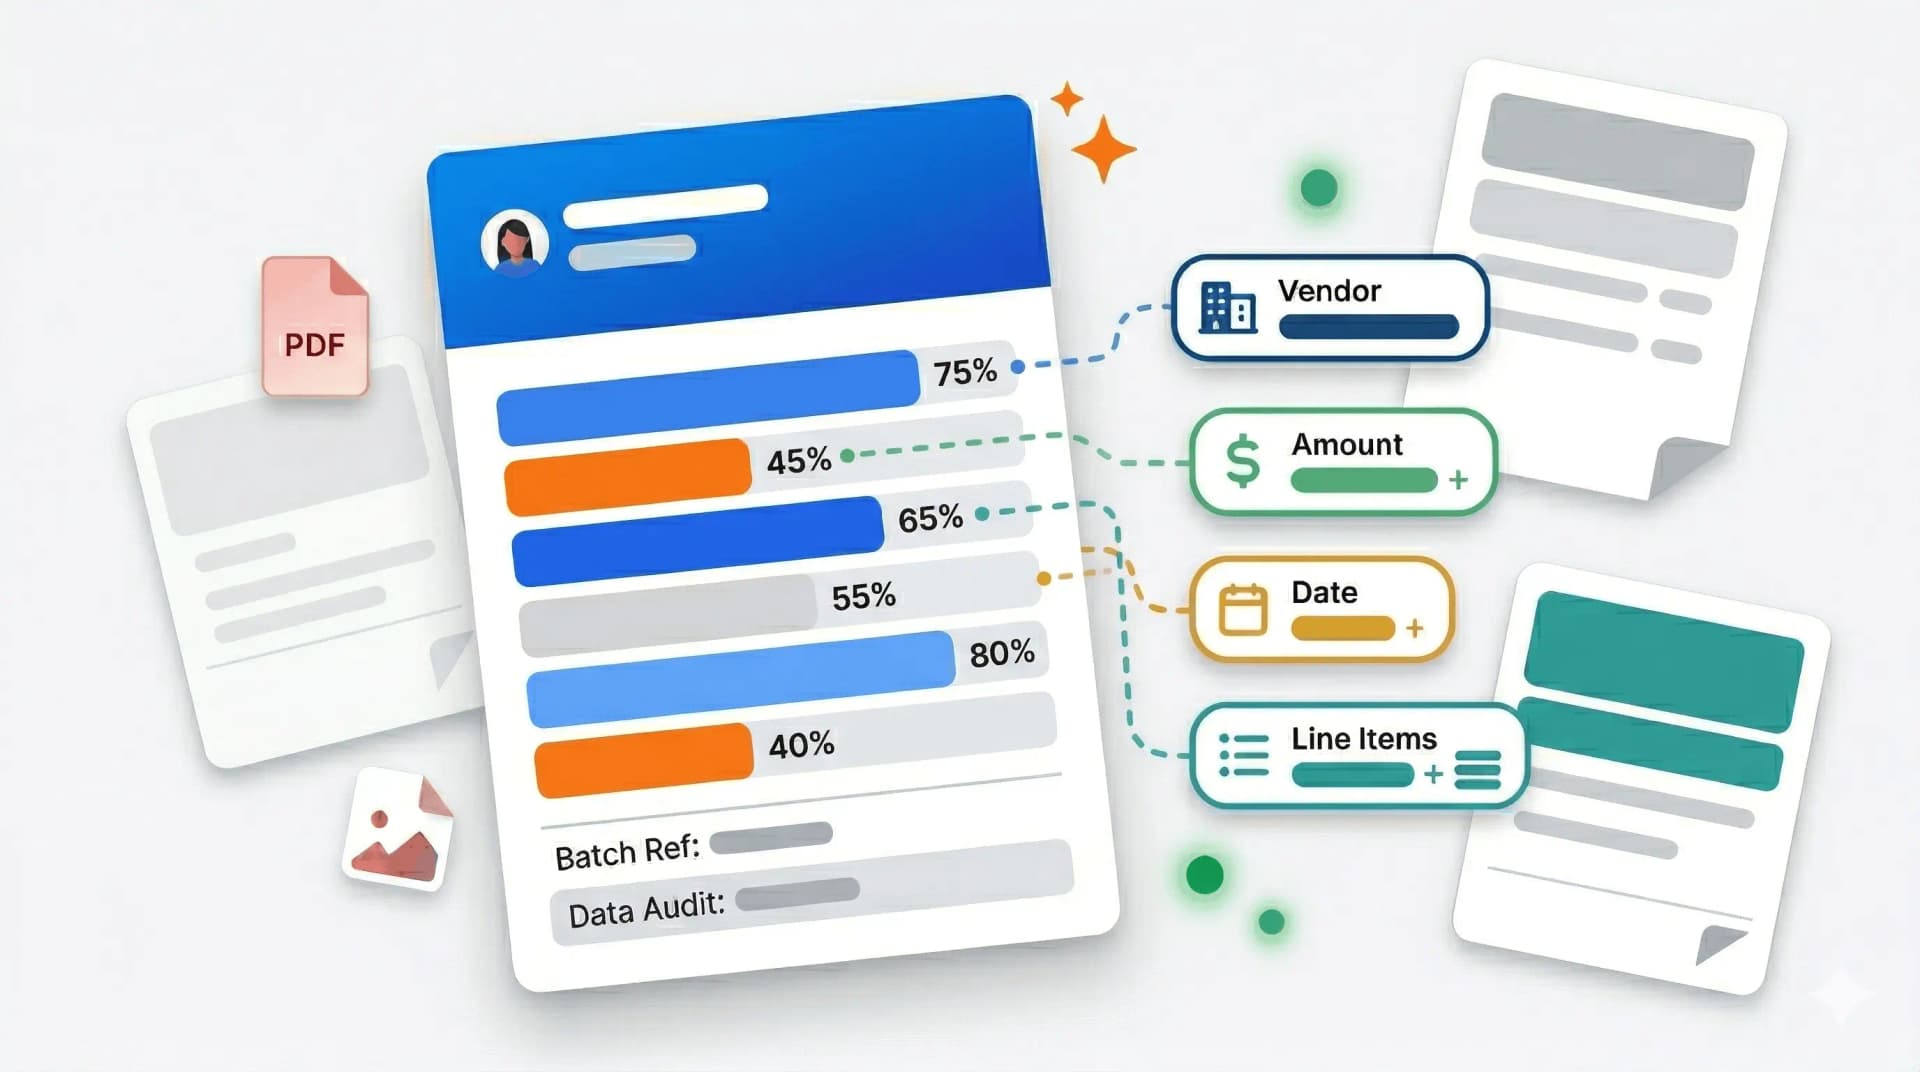
Snap and upload: Take a phone photo of the delivery invoice at the back door, or forward the PDF from your supplier's email. TRO Matcher accepts 8 formats including HEIC (iPhone), PDF, CSV, and Excel.
-
Automatic data extraction: AI extracts vendor name, line items, quantities, unit prices, and totals in under 60 seconds with confidence scores showing extraction certainty on every field.
-
Side-by-side comparison: Compare the invoice against your purchase order or last week's pricing from the same supplier. Price variances are highlighted instantly—no more scanning columns of numbers.
-
Variance analysis: The system calculates percentage differences, flags price increases above threshold, and identifies items where you're paying more than last order.
-
Export to accounting: Download results as CSV for import into QuickBooks, Xero, or your accounting software, or as PDF for your records.
From Phone Photo to Verified Invoice in 60 Seconds
Most restaurant owners never check invoices against what they actually ordered. Not because they don't care—because who has time? Paper invoices arrive with morning deliveries. PDFs show up at 3am. WhatsApp photos from the fish market. Handwritten tickets from the specialty cheese guy.
You can type all of this into a spreadsheet, 15-20 minutes per invoice, and make a few mistakes along the way. Or you can photograph it.
"Now I shoot every invoice the moment it shows up. By the time the prep cook finishes unloading, I've already checked the prices on my phone. First week, I found my fish supplier had been adding 12% to seabass. Five months of that." — Sarah Chen, Owner, City Bistro, Manchester
Wrinkled, coffee-stained, half-crumpled—the phone camera doesn't care. Each line item, quantity, and price gets pulled out with a confidence score. Low confidence means "look at this one." High confidence means move on. Export to CSV for QuickBooks in one click.
For a restaurant processing 40-60 supplier invoices weekly, that's the difference between 10-13 hours of data entry and 1-2 hours of review.
Time and accuracy comparison for a typical independent restaurant:
| Task | Manual Method | AI Method (TRO Matcher) |
|---|---|---|
| Process one supplier invoice | 15-20 min | 1-2 min |
| Compare 3 vendor quotes for proteins | 30-45 min | 2-3 min |
| Weekly invoice review (40 invoices) | 10-13 hours | 1-2 hours |
| Compare quotes from multiple suppliers | 30-45 min per set | 2-3 min per set |
| Error rate | 1-4% (industry benchmark) | ~0% (with human review) |
| Annual time saved | — | 400+ hours |
For a restaurant owner who bills their time at $50/hour (or could be spending that time on revenue-generating work), that's $20,000+ in recovered productive time annually.
Restaurant operators who compare every invoice against their purchase orders catch pricing discrepancies that would have gone undetected with manual spot-checking—most commonly undisclosed price increases and quantity shortfalls.
Related reading: Invoice Comparison vs Manual Excel: Time & Cost Analysis breaks down the full ROI calculation for small businesses switching from spreadsheets to AI-powered comparison.
Also see: Manufacturing Procurement: Comparing Vendor Quotes Fast — manufacturers share many of the same vendor pricing challenges as restaurants. Plus: How Construction Companies Save 30% on Material Costs — construction contractors use the same systematic quote comparison to protect margins.
For retailers: Retail Inventory: Stop Overpaying Wholesale Suppliers — independent retailers face similar wholesale supplier pricing challenges, with 1-5% overpayment rates that compound across dozens of vendors.
For a comprehensive overview of receipt scanning options, see our receipt scanning software guide.
Restaurant Supplier Management: Strategies for Food Cost Control
Based on industry research and restaurant operator data, these five strategies deliver measurable ROI for independent restaurants:
1. Compare every invoice to the purchase order
This is the foundation of cost control. When every invoice is automatically compared to the PO or verbal quote, supplier price creep becomes impossible to hide. Most restaurant owners only spot-check—AI makes 100% verification realistic.
Potential savings: 2-5% recovered from caught discrepancies
2. Dual-source critical ingredients
For your top 5-10 highest-cost ingredients (typically proteins and dairy), maintain relationships with at least two suppliers. Regular price comparison gives you negotiation leverage and supply security.
Potential savings: 5-12% on dual-sourced categories
3. Negotiate based on purchase data, not memory
When you can show a supplier your exact purchase history—volumes, frequency, price trends—negotiations become data-driven instead of adversarial. Most small restaurants negotiate on gut feel because they don't have the data. AI extraction tools create this data automatically.
Potential savings: 3-8% through data-backed negotiation
4. Consolidate orders strategically
Combining smaller daily orders into fewer, larger deliveries reduces per-unit costs and delivery charges. A restaurant placing 3 produce orders per week at $500 each may save 5-8% by consolidating to 2 orders at $750.
Potential savings: 5-10% on consolidated orders
5. Track seasonal pricing patterns
Ingredient prices follow seasonal cycles. Buying proteins when prices dip seasonally (and adjusting menus accordingly) can significantly reduce food costs. AI tools that track pricing over time make these patterns visible without manual spreadsheet analysis.
Potential savings: 3-7% through strategic seasonal purchasing
How should restaurant owners track food cost percentage?
Food cost percentage is the most critical metric for restaurant profitability. The target range depends on your restaurant type, but staying within bounds requires weekly monitoring—not the monthly or quarterly review most independent operators manage.
Target food cost percentages by restaurant type:
| Restaurant Type | Target Food Cost % | Gross Margin | Typical Net Margin |
|---|---|---|---|
| Quick-service (QSR) | 28-32% | 68-72% | 6-9% |
| Casual dining | 30-34% | 66-70% | 3-6% |
| Fine dining | 32-35% | 65-68% | 3-5% |
| Ghost kitchen / delivery | 25-30% | 70-75% | 10-30% |
Source: National Restaurant Association, USDA Food Price Outlook
The food cost percentage formula:
Food Cost % = (Beginning Inventory + Purchases - Ending Inventory) ÷ Food Sales × 100
The challenge isn't the formula—it's getting accurate purchase data. When invoices are processed manually, data entry errors of 1-4% directly distort your food cost calculations. You can't control what you can't measure accurately.
Weekly food cost tracking with AI:
- Upload all supplier invoices as they arrive (photo from phone, email forward, or PDF upload)
- AI extracts pricing data automatically—no manual entry
- Compare costs against your menu pricing to calculate real-time food cost percentage
- Export weekly CSV data for import into QuickBooks, Xero, or your accounting software
"Restaurants using modern menu engineering and cost tracking tools typically add 2-5% to their bottom line within months." — Pacific ABS
When your food cost percentage starts climbing, you catch it in days instead of months—before it erodes an entire quarter's profit.
For Accountants and Bookkeepers Serving Restaurants
If you manage finances for restaurant clients, you know the unique challenge: high invoice volume, weekly or daily deliveries, volatile ingredient pricing, and clients who are too busy cooking to check their supplier bills.
How TRO Matcher helps accounting professionals serving restaurants:
- Fast invoice comparison: Upload client invoices in any format, get side-by-side price variance analysis showing every difference across suppliers
- Audit-ready documentation: Every comparison is timestamped and exportable—essential for restaurant clients facing health department, tax, or insurance audits
- Client-ready exports: Professional PDF reports showing exactly where supplier pricing has increased, with dollar impact calculated
- Export to accounting software: CSV and Excel spreadsheet exports ready for import into QuickBooks, Xero, and other accounting platforms
The partnership opportunity: Restaurant owners are desperate for help controlling food costs. When you can show a client you identified $800 in monthly supplier overcharges during routine bookkeeping, that conversation transforms your relationship from "cost center" to "profit protector."
Accountants who introduce invoice automation to their restaurant clients become indispensable. The tool does the data extraction; your expertise in interpreting it and recommending action is what clients pay you for.
Your Data, Your Control: GDPR Article 20 Compliance
Unlike restaurant management platforms that lock your supplier data in proprietary formats, TRO Matcher ensures you always own and control your information.
Why data portability matters for restaurant owners:
- Tax audit readiness: Export complete supplier invoice history for HMRC, IRS, or local tax authority audits—restaurant audits often focus on food cost verification
- Switching freedom: If you change systems or accounting software, take all your data with you—no vendor lock-in
- Insurance documentation: Maintain proof of supplier pricing for business insurance claims and lease disputes
- GDPR Article 20 compliance: Full self-service data export at any time in standard formats (CSV, PDF)
What you can export:
- All uploaded supplier invoices and extracted data
- Every comparison report with price variance analysis
- Complete vendor pricing history over time
- AI recommendations and comparison results
No phone calls to support, no "export fees," no waiting. Your data is yours—download it anytime.
TRO Matcher vs. Alternative Solutions
| Feature | TRO Matcher | Spreadsheets | Restaurant-Specific AP (MarketMan, R365) |
|---|---|---|---|
| Setup time | 5 minutes | N/A | Days to weeks |
| Monthly cost | $0-19 | Free | $200-800+/month |
| Learning curve | None | Moderate | Requires training |
| Invoice data extraction | AI-automated (60s) | Manual typing | Varies by platform |
| Accuracy | Up to 99% + confidence scores | 96-99% (1-4% error rate) | Varies |
| Phone photo support | Yes (HEIC, JPG, PNG) | No | Some platforms |
| Vendor quote comparison | AI side-by-side | Manual formulas | Limited |
| Data export | One-click (GDPR Art. 20) | Already in Excel | Often restricted |
| Multi-format support | 8 formats | Manual copy-paste | PDF/CSV typically |
| Minimum business size | 1 person | Any | Usually multi-location |
| POS integration required | No | No | Usually yes |
Restaurant-specific platforms like MarketMan and Restaurant365 offer deeper POS and inventory integration, but they cost 4-16x more and require significant setup. Generic invoice capture tools like Dext ($25+/month), Shoeboxed ($9-79/month), and AutoEntry ($12+/month, credit-based) focus on extraction without restaurant-specific comparison features. For independent restaurants who need invoice comparison and supplier cost control without the complexity of a full restaurant management system, TRO Matcher delivers the core value at a fraction of the cost.
Case Study: Restaurant Invoice Verification Cuts Food Costs 5.2%
The Olive Branch was bleeding money. Food costs had crept up to 34.8%—nearly 3 points above their 32% target. Owner-chef Sarah Chen suspected supplier creep but couldn't prove it. With 4 main suppliers and 8 specialty vendors, invoices arrived in mixed formats: email PDFs, paper invoices with deliveries, WhatsApp photos from market vendors.
Invoice review happened "every few weeks when there was a quiet afternoon"—which meant 2-3 weeks of invoices processed in one batch with minimal verification.
"I uploaded 3 months of invoices on a Saturday afternoon," Sarah says. "By Sunday, I'd found £650 in overcharges I'd approved myself."
The seabass alone was saving her £180/month—her fish supplier had increased prices 12% without telling her.
The turnaround after 4 months:
| Metric | Before | After |
|---|---|---|
| Food cost percentage | 34.8% | 29.6% |
| Overpayment rate | 2.3% | 0.4% |
| Quote comparison time | 45+ minutes | 3 minutes |
| Credits tracked | Lost ~£200/quarter | 100% applied |
Within 12 weeks, they'd brought food costs down to 29.6%—a 5.2 percentage point improvement. First-year recovery: £3,900 from price discrepancies, £4,200 from data-backed supplier negotiations, and 250+ hours redirected from invoice processing to kitchen operations.
Most restaurant owners find their first supplier overcharge within the first week. Start with your highest-cost suppliers—that's where the hidden money is.
Frequently Asked Questions
What is the average food cost percentage for restaurants in 2026?
The average restaurant food cost percentage falls between 28% and 35% of revenue, varying by restaurant type. Quick-service restaurants average 28-32%, casual dining 30-34%, and fine dining 32-35% (National Restaurant Association). With the USDA predicting food-away-from-home prices to rise 3.7% in 2026, staying within your target range requires systematic supplier invoice monitoring—not quarterly spot-checks.
How much can restaurant owners save with AI invoice comparison?
Restaurant operators using AI invoice comparison typically reduce food costs by 3-7% within eight to twelve weeks through catching pricing errors and negotiating with data. For a restaurant spending $15,000 monthly on food and beverage, that represents $450-$1,050 in monthly savings. The savings come from catching pricing errors, identifying vendor overcharges, comparing quotes accurately, and negotiating better rates with data visibility. Even the free tier delivers value for lower-volume operations.
What are the biggest supplier cost challenges for independent restaurants?
The top challenges include volatile ingredient prices (beef up 5.5% forecast for 2026 after climbing 15% in 2025), managing dozens of vendor invoices weekly in mixed formats, supplier price creep between quoted and invoiced amounts, slim 3-5% profit margins that leave no room for overpayments, and lack of back-office staff to verify every delivery. With 42% of operators not profitable in 2025 (NRA 2026), automation is the only realistic path to consistent cost control.
How does supplier price creep affect restaurant profitability?
Supplier price creep—vendors gradually increasing prices between agreed terms and actual invoices—is one of the most insidious margin killers in the restaurant industry. With net margins averaging 3-5%, a 2% undetected price increase on $180,000 annual food spend costs $3,600/year. That's nearly a month of net profit for many independent restaurants. AI invoice comparison catches these increases automatically by comparing each invoice against previous pricing.
Can small single-location restaurants benefit from invoice comparison tools?
Single-location restaurants often benefit the most because they lack dedicated procurement staff. The owner is simultaneously chef, manager, and bookkeeper—invoice verification is always the lowest priority task. TRO Matcher starts free with 10 extractions and 5 comparisons, requires no IT setup, and processes invoices in under 60 seconds. Snap a phone photo of a delivery invoice and verify pricing from your kitchen.
How do restaurant owners track food costs across multiple suppliers?
AI invoice comparison tools automatically extract pricing data from supplier invoices in any format and create side-by-side comparisons. TRO Matcher processes PDFs, photos, CSV, and Excel files, highlighting price variances instantly. This replaces the manual process of entering data into spreadsheets—which takes 15-20 minutes per invoice with a 1-4% error rate. You can export comparison data as CSV to track pricing trends in your own spreadsheets over time.
Is restaurant invoice data exportable and GDPR compliant?
Yes. TRO Matcher is fully GDPR compliant including Article 20 Data Portability. Export all your invoice data, supplier comparisons, and extracted pricing in CSV or PDF format at any time. CSV exports are formatted for easy import into QuickBooks, Xero, and other restaurant accounting software. No export fees, no waiting, no vendor lock-in. For restaurants, this audit trail is especially important for health department inspections, tax documentation, and insurance claims.
What is the ROI timeline for restaurant invoice comparison software?
Most restaurant owners see positive ROI within the first month. Based on time savings of 3-4 hours weekly at $50/hour opportunity cost, plus 1-3% food cost reduction from catching pricing errors, even the Pro plan ($19/month) pays for itself many times over. A restaurant spending $15,000 monthly on food typically identifies $500-$1,500 in monthly savings within the first 60 days. The free tier with 10 extractions and 5 comparisons lets you verify the value before committing.
Sources and Methodology
This analysis is based on:
- USDA Economic Research Service: Food Price Outlook — 2026 food price predictions and category-level inflation data
- National Restaurant Association: Inflation Data and Menu Price Trends — industry-level cost benchmarks
- Restaurant365: 2026 Industry Survey — operator sentiment across 4,000 locations
- Bureau of Labor Statistics: 2025 CPI Review — producer price indexes for food categories
- TRO Matcher Platform Data: Analysis of restaurant invoice comparisons processed through our platform
- AP Industry Benchmarks: Manual data entry error rates (1-4%, widely cited in IOFM and APQC research)
Bottom Line
For independent restaurant owners, food cost control isn't a back-office task—it's the single biggest lever for profitability. With 91% of operators reporting higher-than-expected food costs in 2025, beef prices forecast to rise another 9.4%, and profit margins averaging 3-5%, every undetected supplier overcharge directly erodes your livelihood.
The restaurants that survive in 2026 won't be the ones with the best recipes—they'll be the ones that know exactly what they're paying for every ingredient, every delivery, every week.
"AI-powered invoice comparison helps restaurant owners reduce food costs by 3-7% by catching supplier price creep, comparing vendor quotes in minutes instead of hours, and providing data-backed negotiation leverage. For independent restaurants operating on 3-5% net margins and spending $180,000+ annually on food, automated supplier cost control recovers $5,400-$12,600 per year—with full GDPR Article 20 data portability for audit compliance."
Ready to stop overpaying your suppliers? Photograph your next delivery invoice — no credit card required. See results before your dinner service starts.
Find Out If Your Food Suppliers Are Overcharging You
Snap a photo of your supplier invoice and get AI-powered cost analysis in 60 seconds. Free to start — no credit card required.
Start Free